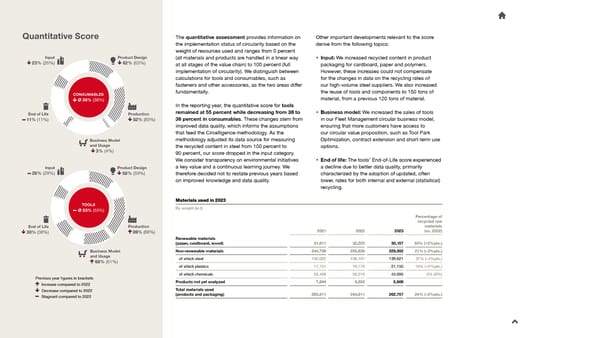
Quantitative Score The quantitative assessment provides information on Other important developments relevant to the score the implementation status of circularity based on the derive from the following topics: weight of resources used and ranges from 0 percent Input Product Design (all materials and products are handled in a linear way • Input: We increased recycled content in product 23% (26%) 62% (63%) packaging for cardboard, paper and polymers. at all stages of the value chain) to 100 percent (full However, these increases could not compensate implementation of circularity). We distinguish between for the changes in data on the recycling rates of calculations for tools and consumables, such as our high-volume steel suppliers. We also increased fasteners and other accessories, as the two areas differ CONSUMABLES fundamentally. the reuse of tools and components to 150 tons of Ø36% (38%) material, from a previous 120 tons of material. In the reporting year, the quantitative score for tools End of Life Production remained at 55 percent while decreasing from 38 to • Business model: We increased the sales of tools 11% (11%) 82% (83%) 36 percent in consumables. These changes stem from in our Fleet Management circular business model, ensuring that more customers have access to improved data quality, which informs the assumptions our circular value proposition, such as Tool Park that feed the Circelligence methodology. As the Optimization, contract extension and short-term use Business Model methodology adjusted its data source for measuring and Usage the recycled content in steel from 100 percent to options. 3% (4%) 90 percent, our score dropped in the input category. We consider transparency on environmental initiatives • End of life: The tools’ End-of-Life score experienced a decline due to better data quality, primarily Input Product Design a key value and a continuous learning journey. We 28% (28%) 58% (59%) characterized by the adoption of updated, often therefore decided not to restate previous years based lower, rates for both internal and external (statistical) on improved knowledge and data quality. recycling. TOOLS MMaatteerriiaalls us usseed id in 2n 2002233 Ø55% (55%) By weight (in t) Percentage of recycled raw End of Life Production materials 30% (38%) 89% (88%) 2021 2022 2023 (vs. 2022) Renewable materials (paper, cardboard, wood) 31,611 32,220 30,157 50% (+2%pts.) Business Model Non-renewable materials 244,736 255,839 226,992 21% (–3%pts.) and Usage of which steel 152,622 158,197 139,621 31% (–4%pts.) 68% (61%) of which plastics 17,751 19,779 21,155 10% (+2%pts.) of which chemicals 53,468 56,210 45,695 0% (0%) Previous year 昀椀gures in brackets Products not yet analyzed 7,564 6,552 5,608 Increase compared to 2022 Decrease compared to 2022 Total materials used (products and packaging) 283,911 294,611 262,757 24% (–2%pts.) Stagnant compared to 2022
 2023 Sustainability Report Page 22 Page 24