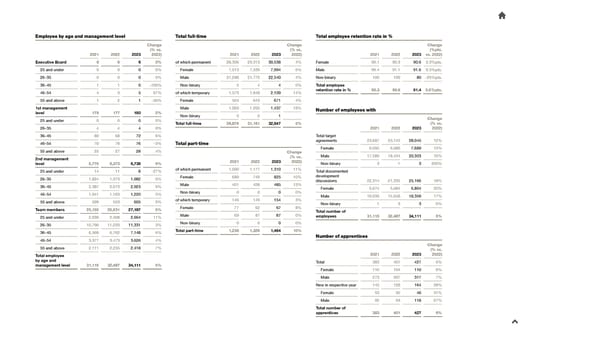
EmpEmpllooyyeeee b byy ag agee a anndd m maannagageemmenentt le levvelel TToottaall fu fullll--ttimeime TToottaal el emmppllooyyeee re reetteennttiioon rn raatte ie in %n % Change Change Change (% vs. (% vs. (%pts. 2021 2022 2023 2022) 2021 2022 2023 2022) 2021 2022 2023 vs. 2022) Executive Board 6 6 6 0% of which permanent 28,306 29,313 30,538 4% Female 90.1 90.3 90.6 0.3%pts. 25 and under 0 0 0 0% Female 7,013 7,539 7,994 6% Male 90.4 91.1 91.6 0.5%pts. 26–35 0 0 0 0% Male 21,288 21,770 22,540 4% Non-binary 100 100 80 –20%pts. 36–45 1 1 0 –100% Non-binary 5 4 4 0% Total employee 46–54 4 3 5 67% of which temporary 1,573 1,848 2,109 14% retention rate in % 90.3 90.9 91.4 0.5%pts. 55 and above 1 2 1 –50% Female 504 643 671 4% 1st management Male 1,069 1,205 1,437 19% NNumumbberer o off em emppllooyyeeeess wi witthh level 179 177 180 2% Non-binary 0 0 1 25 and under 0 0 0 0% Change Total full-time 29,879 31,161 32,647 5% (% vs. 26–35 4 4 4 0% 2021 2022 2023 2022) 36–45 80 68 72 6% Total target 46–54 70 78 76 –3% TToottaall pa parrtt--ttiimmee agreements 23,687 25,145 28,045 12% 55 and above 25 27 28 4% Change Female 6,095 6,686 7,689 15% 2nd management (% vs. Male 17,589 18,454 20,353 10% level 5,775 6,373 6,738 6% 2021 2022 2023 2022) Non-binary 3 1 3 200% 25 and under 14 11 8 –27% of which permanent 1,090 1,177 1,310 11% Total documented 26–35 1,824 1,973 1,982 0% Female 689 749 825 10% development Male 401 428 485 13% discussions 22,314 21,335 25,166 18% 36–45 2,387 2,673 2,923 9% Female 5,674 5,684 6,804 20% 46–54 1,041 1,163 1,220 5% Non-binary 0 0 0 0% Male 16,639 15,648 18,359 17% 55 and above 509 553 605 9% of which temporary 146 149 154 3% Non-binary 1 3 3 0% Team members 25,155 25,931 27,187 5% Female 77 62 67 8% Total number of 25 and under 2,039 2,408 2,664 11% Male 69 87 87 0% employees 31,115 32,487 34,111 5% 26–35 10,790 11,033 11,331 3% Non-binary 0 0 0 0% 36–45 6,568 6,762 7,148 6% Total part-time 1,236 1,326 1,464 10% 46–54 3,377 3,473 3,626 4% NNumumbberer o off a apppprreennttiicceess 55 and above 2,111 2,255 2,418 7% Change (% vs. Total employee 2021 2022 2023 2022) by age and Total 383 401 427 6% management level 31,115 32,487 34,111 5% Female 110 104 110 6% Male 273 297 317 7% New in respective year 145 128 164 28% Female 53 35 46 31% Male 92 93 118 27% Total number of apprentices 383 401 427 6%
 2023 Sustainability Report Page 49 Page 51