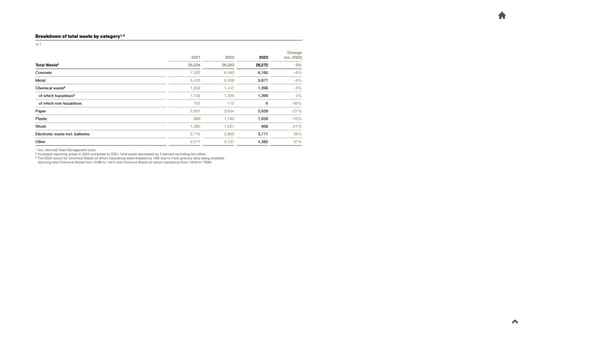
1,1, 2 2 BBrreeaakdkdoowwn on of tf toottaal wl waasstte be by cy caatteeggoorry y in t Change 2021 2022 2023 (vs. 2022) Total Waste33 25,224 26,353 26,272 0% Concrete 7,522 6,583 6,160 –6% Metal 6,433 6,268 5,877 –6% Chemical waste33 1,252 1,441 1,396 –3% of which hazardous33 1,152 1,326 1,390 5% of which non-hazardous 101 115 6 –95% Paper 2,951 3,654 2,659 –27% Plastic 889 1,180 1,059 –10% Wood 1,385 1,227 968 –21% Electronic waste incl. batteries 2,715 2,803 3,771 35% Other 2,077 3,197 4,382 37% 11 Incl. returned Fleet Management tools 22 Increased reporting scope in 2022 compared to 2021; total waste decreased by 2 percent excluding this effect 33 The 2022 values for Chemical Waste (of which hazardous) were restated by 108t due to more granular data being available, reducing total Chemical Waste from 1549t to 1441t and Chemical Waste (of which hazardous) from 1434t to 1326t.
 2023 Sustainability Report Page 29 Page 31